
Complaints from OCP suppliers raise a practical question: how can a group able to raise billions still have contractors waiting to be paid? Answering it requires looking separately at invoice due dates, cash resources and financial performance. These measures describe different aspects of a business.
Since the original version of this article, OCP has published its accounts for the six months to 30 June 2026, released on 29 September. They change the picture substantially: the group holds more cash than at the end of 2025, while reporting a loss attributable to its owners and lower operating profitability. The documents provide evidence, but cannot turn individual complaints into a comprehensive assessment of all payments.
At the end of 2025, MAD 1.707 billion in supplier liabilities was classified as overdue
The 2025 financial statements, printed page 29, contain a maturity schedule in OCP SA’s separate financial statements. The “Suppliers and related accounts” line totals MAD 16,514,476,839. Of that amount, MAD 1,707,172,606 appears in the column headed “Échues et non recouvrées”, indicating overdue amounts. Our calculation puts this at approximately 10.3% of the line.
The amount is therefore documented in an official publication. The table does not, however, identify the number of suppliers affected, provide a detailed aging analysis or explain each overdue balance. It does not establish how much relates to disputes, pending approval or uncontested late payments. These possible explanations should not be presented as established facts about OCP’s individual cases.
OCP SA and the consolidated group are different reporting entities
The MAD 16.514 billion figure concerns OCP SA alone. The consolidated statements cover the entities included in the group under IFRS. Their “Trade payables” line reaches MAD 34.013 billion at 30 June 2026, compared with MAD 30.244 billion at 31 December 2025 (consolidated balance sheet, printed page 6).
This increase of approximately MAD 3.8 billion does not measure overdue invoices alone: trade payables also include invoices that are not yet due. Comparing OCP SA’s MAD 16.514 billion directly with the consolidated MAD 34.013 billion would be misleading, because both the reporting date and the reporting perimeter differ.
How supplier credit supports cash flow
In the 2025 consolidated cash flow statement, the change in trade payables contributes positively by MAD 1.886 billion through working capital movements. In the first half of 2026, that contribution reaches MAD 4.475 billion, compared with MAD 3.775 billion in the first half of 2025 (cash flow statement, printed page 7).
The mechanism is straightforward: a cost that has been recorded but not yet paid temporarily leaves cash within the business. An increase in this balance can support liquidity. It does not by itself prove a decision to pay late: purchase volumes, delivery schedules and contractual terms also affect it. The cash flow effect and compliance with each invoice’s due date are separate questions.
The major update: MAD 32.692 billion in cash at the end of June 2026
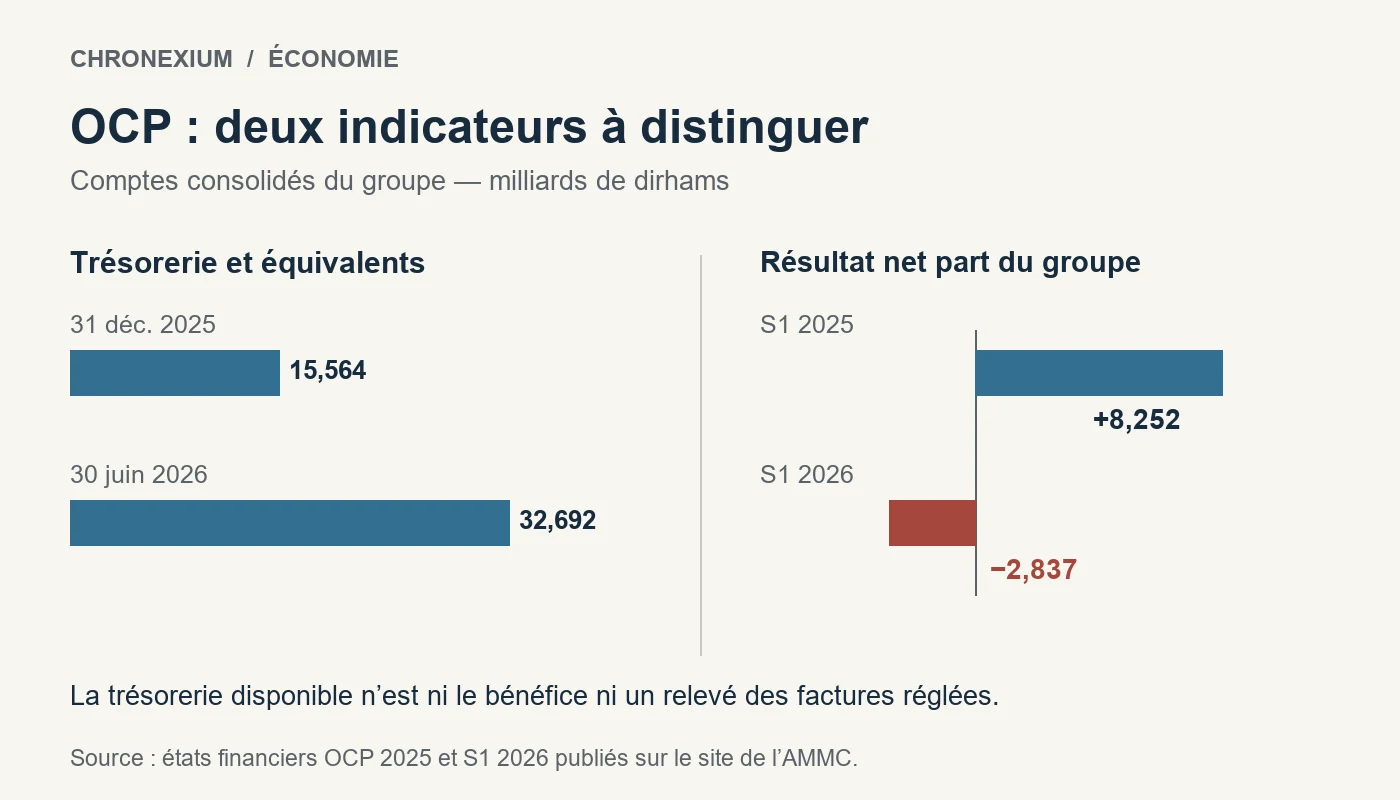
The original article referred to MAD 15.564 billion in cash and cash equivalents at the end of 2025. The half-year statements now report MAD 32.692 billion at 30 June 2026. The December balance should no longer be described as the latest available figure.
The source of the increase also matters. The cash flow statement shows MAD 6.718 billion in net cash generated by operating activities, MAD 15.981 billion in net cash used in investing activities and MAD 26.314 billion in net cash from financing activities. Financing includes borrowings and changes in perpetual subordinated instruments, less repayments and other financing outflows.
The group’s note on significant events also describes bond financing and the monetization of VAT receivables. The rise in cash cannot therefore be treated as additional profit earned from sales. Nor does it identify which suppliers were paid after the reporting date.
Positive EBITDA alongside a loss attributable to the group’s owners
The half-year consolidated income statement reports revenue of MAD 48.372 billion, compared with MAD 52.166 billion a year earlier, a fall of 7.3%. EBITDA declines from MAD 18.612 billion to MAD 13.307 billion. According to the group’s release, its EBITDA margin falls from 36% to 28%.
The net result attributable to the group’s owners is a loss of MAD 2.837 billion, following a profit of MAD 8.252 billion in the first half of 2025. The total loss for the period, including non-controlling interests, is MAD 2.546 billion; this is a different measure. The financial result moves from a gain of MAD 2.845 billion to a loss of MAD 4.831 billion.
Calling the group simply “profitable” in 2026 on the basis of its full-year 2025 EBITDA would therefore be incomplete. Operating activities retain positive EBITDA, while financing costs, depreciation, other items and taxes lead to a net loss for the half-year. None of these measures, viewed alone, resolves the issue of outstanding invoices.
Sulfur costs and global demand squeeze margins
In its half-year release dated 29 September, OCP describes two pressures: more expensive inputs, including sulfur and ammonia, and weaker global demand as fertilizer becomes less affordable for farmers. Sulfur is used to make the sulfuric acid needed to process phosphate. Higher sulfur prices therefore raise production costs, which cannot necessarily be passed on fully through selling prices.
The group says it diversified supplies and increased its focus on triple superphosphate, or TSP, which uses less sulfur and no ammonia. According to the same release, TSP accounted for 35% of fertilizer export volumes in the first half of 2026, compared with 26% a year earlier. These adjustments explain industrial pressure on margins; they do not establish the cause of each delayed payment.
Investment fell in the second quarter, but rose over the half-year
The 31 August 2026 release states that second-quarter capital expenditure fell to MAD 5.924 billion from MAD 9.228 billion a year earlier, a decline of 36%. Over the full first half, however, expenditure reached MAD 16.067 billion, compared with MAD 15.162 billion, an increase of approximately 6%.
This distinction is essential to understanding the group’s industrial decisions. OCP says payments for strategic projects were concentrated in the first quarter and anticipates more moderate spending over the rest of the year. A slower quarter consequently means neither a general investment halt nor a 36% reduction across the six-month period.
Contractor complaints and the proposed bank financing scheme
Le Monde’s report of 8 September describes subcontractors complaining about unpaid invoices and notes that OCP had not confirmed their accounts in that report. Le Desk’s report of 4 September describes a proposed bank financing scheme for businesses in OCP’s ecosystem, backed by a label issued by the group.
These reports must remain attributed to their publishers. They are not a verification by Chronexium of every invoice, nor evidence that an announced scheme is already available to all suppliers. A loan may bridge a small business’s cash flow gap; it does not replace payment of its receivable and may also impose financing costs on that business.
What the figures actually establish
The question goes beyond whether OCP “still has money”. The publications show substantial cash at the end of June, supported in part by financing, alongside weaker operating profitability, a loss attributable to the group’s owners and a large trade payable balance. They also document supplier liabilities classified as overdue in OCP SA’s accounts at the end of 2025.
Assessing suppliers’ current position would require a recent aging schedule of overdue invoices and information about subsequent payments and disputes. The December 2025 figures do not establish that the same MAD 1.707 billion remains unpaid in November 2026. Equally, the half-year statements do not establish that all reported delays have been resolved. Those are the specific questions future reporting needs to address.